ChartView::cache_t Struct Reference
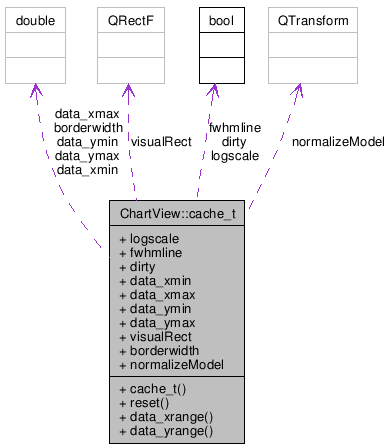
Collaboration diagram for ChartView::cache_t:
Public Member Functions | |
| cache_t () | |
| void | reset () |
| double | data_xrange () const |
| double | data_yrange () const |
Public Attributes | |
| bool | logscale |
| The y-Axis is to be scaled logarithmic. | |
| bool | fwhmline |
| Display a fwhm-line. | |
| bool | dirty |
| This cache is dirty and has to be re-set. | |
| double | data_xmin |
| Min and Max of the values in the model. | |
| double | data_xmax |
| double | data_ymin |
| double | data_ymax |
| QRectF | visualRect |
| Visual rect in the viewport. Will be surrounded by the border. | |
| double | borderwidth |
| border | |
| QTransform | normalizeModel |
| Transform the coordinates of the model to normalized values between 0 and 1. | |
Constructor & Destructor Documentation
| ChartView::cache_t::cache_t | ( | ) | [inline] |
References reset().
Member Function Documentation
| void ChartView::cache_t::reset | ( | ) | [inline] |
Member Data Documentation
The y-Axis is to be scaled logarithmic.
Referenced by ChartView::logarithmicScale(), and ChartView::setLogarithmicScale().
Referenced by data_xrange(), and reset().
Referenced by data_yrange(), and reset().
Referenced by data_yrange(), and reset().
Visual rect in the viewport. Will be surrounded by the border.
border
| QTransform ChartView::cache_t::normalizeModel |
Transform the coordinates of the model to normalized values between 0 and 1.
The documentation for this struct was generated from the following file: